I’ve been building Slips — a collaborative, real-time task list app — as part of a series of lightweight, self-hostable tools. One constraint: the backend would be written primarily by an LLM, with me in the role of technical director rather than primary author. The result was three functionally identical server implementations: Node.js, Go, and Swift. Same API surface, same SQLite persistence, same WebSocket sync protocol. Drop-in replacements for each other.
It started as a productivity experiment. It ended up being a pretty good audit of where LLMs fall short, what “idiomatic” code actually costs at runtime, and a few embarrassing assumptions on my part.
The Setup
Slips has real-time sync over WebSockets using Automerge and CRDTs. The HTTP side is standard CRUD — create a list, fetch it by share token, manage tasks. Every request that looks up a list derives an ID by hashing the token with SHA-256. Sounds boring. Turns out where you hash things matters a lot.
All three backends run SQLite in WAL mode (more on that later), on the same machine (Apple M1 Pro, macOS), benchmarked with a Go tool running 200 ops at 10 concurrent workers.
Node.js came first and got the most hand-holding — detailed prompts, iterative corrections, explicit direction. Go and Swift were reimplementations with lighter prompting: “here’s what this does, look at that fugly JS code, use the language the way it was meant to be used.”
Node.js
The stack was reasonable: Express, better-sqlite3, ws. Standard stuff, nothing surprising.
The first benchmark came back at around 1,400 ops/s on sequential POSTs. Not embarrassing, but also not where I expected to land.
Web Crypto surprise
The token hashing function — called on every single request — was using crypto.subtle.digest. That’s the modern, standards-compliant Web Crypto API. It’s also async, so every request was dispatching to the thread pool and resolving a Promise to compute one SHA-256 hash.
Swapping to createHash('sha256') from Node’s built-in crypto module — a synchronous C++ binding, direct calls to OpenSSL — took sequential POST throughput from ~1,153 to ~2,848 ops/s. 2.5x from one function call. Yikes.
The same file had an interesting token generation implementation: a spread operator into btoa() followed by three regex passes to sanitize the base64 output. What in the holy convoluted batman is this. One randomBytes(32).toString('base64url') call does the same thing. As if it just tried things until it made it work — which tracks, because this implementation needed the most hand-holding and still seemed to not fully grasp the spec even after we worked it out upfront.
Logging overhead
Debug output to stderr with the default log level was eating a measurable slice of request time. LOG_LEVEL=error recovered 2,975 ops/s — matching the historical best. Not a criticism of the LLM; just a reminder that benchmarking with debug logging on is benchmarking the logger.
SQLite WAL mode
WAL decouples readers and writers — readers get a consistent snapshot while a write is in progress, instead of serializing behind it. For 10 concurrent writers this matters a lot. Measured on the Go backend: ~5x improvement on both sequential and concurrent writes. All three backends ended up with WAL enabled; Go and Node needed an explicit PRAGMA, Swift’s GRDB enables it automatically via DatabasePool. Why that isn’t the default to begin with, I have no idea.
Final Node.js: 2,975 ops/s sequential POST, ~1,024 ops/s GET by token, 121.8 MB RSS idle.
Swift
I expected Swift to be the fastest - ARC instead of GC, native ARM64, Apple hardware, Apple frameworks on Apple silicon — seemed like a slam dunk.
First benchmark: 139 ops/s on GET by token. Go was doing over 3,000. Uh, oh.
The actor hop
The LLM structured the backend as two actors: API handling routing, calling into Store for persistence. That sounds like a natural Swift 6 architecture — separate concerns, compile-time safety, clean. It’s also two cooperative executor suspensions per request, each costing ~5–15μs. The code was correct, it passed strict concurrency checking, and it was 20× slower than Go.
The fix: turn on Swift 6 mode with strict concurrency checking, use lightweight sendable types, value types instead of reference types, keep one Store actor for actual database access. Let the compiler provide additional guardrails the LLM had to follow. Throughput jumped to ~3,300 ops/s.
33 allocations for a hex string
Every request hex-encodes a SHA-256 hash. The LLM used hash.map { String(format: "%02x", $0) }.joined() - a pattern you’ll find in tutorials, in Apple’s docs, all over Stack Overflow.
String(format:) routes through CFStringCreateWithFormat. For each of the 32 bytes: box the UInt8 into NSNumber, allocate an autoreleased CFString, bridge back to a Swift String, land it in an intermediate array. 33 heap allocations per call, all touching the Obj-C autorelease pool. At 5,000 req/s, that’s 165,000 unnecessary allocations per second.
Replaced with a pure-Swift nibble lookup table writing into a pre-allocated [UInt8] buffer, final string via String(decoding:as:). One allocation. GET by token improved +57%.
The same String(format:) antipattern showed up in two more places — token validation using CharacterSet (bridges to NSCharacterSet) and token generation using replacingOccurrences(of:with:) (bridges to NSString). All converted.
Going further
After the lookup table, two allocations remained: the intermediate [UInt8] buffer and a Data copy of the input token. String(unsafeUninitializedCapacity:initializingUTF8With:) writes directly into the String’s storage. withContiguousStorageIfAvailable reads the token’s UTF-8 bytes without copying (Swift 5+ stores strings as UTF-8 internally).
Across 100,000 iterations on M1:
Version
Time
Allocations
Original (map + String(format:))
36,844 ns/op
33+
Lookup table with [UInt8] buffer
7,467 ns/op
3
String(unsafeUninitializedCapacity:)
6,051 ns/op
2
+ no-copy UTF-8 input
5,617 ns/op
1
87% reduction from eliminating Obj-C bridging and copies. Swift can be fast. Getting there means knowing which APIs stay in Swift and which ones quietly drop into Obj-C — and that knowledge doesn’t come from the docs.
Final Swift: 5,049 ops/s GET by token, 8,620 ops/s concurrent POSTs, 56.1 MB RSS. Caveat: Swift’s NIO event loop hit anomalous CPU usage (up to 576% at idle) in some sessions. Historical best was 14,030 ops/s on concurrent writes.
Go
The LLM picked well from the start: net/http, mattn/go-sqlite3 (CGO), gorilla/websocket. Most of the optimization work here was pushing a good baseline further rather than fixing structural mistakes.
WAL + CGO
Switching from modernc.org/sqlite (pure-Go, WASM-based) to mattn/go-sqlite3 (CGO, native library) bumped GET throughput from ~3,608 to ~6,861 ops/s — the CGO version gets the full optimized SQLite C library. WAL on top of that roughly doubled write throughput.
Per-token shard mutexes
One sync.RWMutex protecting all provider state meant 10 concurrent goroutines writing to 10 different lists still serialized. Split into 64 shard-level mutexes keyed by FNV-1a hash of the share token — the provider lock is held briefly for map lookups, the heavy work (Automerge, crypto, SQLite) runs under just the per-token lock.
Metric
Before
After
Change
POST seq (ops/s)
2,907
5,327
+83%
POST c=10 (ops/s)
9,122
15,677
+72%
GET by token (ops/s)
4,739
7,536
+59%
fmt.Sprintf vs hex.EncodeToString
fmt.Sprintf("%x", h) uses reflection. hex.EncodeToString(h[:]) is a direct byte operation. Small per-call, measurable at throughput.
Final Go: 6,866 ops/s GET by token, 12,122 ops/s concurrent POSTs, 44.5 MB RSS.
The Final Comparison
Tested 2026-05-25 on Apple M1 (arm64), macOS 26.0. Three backends, same session, fresh starts, clean databases.
Metric
Go
Swift
Node.js
POST list (seq) ops/s
4,370
3,301
2,975
POST list P50 latency
0.20ms
0.25ms
0.26ms
POST list (c=10) ops/s
12,122
8,620
2,479
GET by token (seq) ops/s
6,866
5,049
1,024
GET by token P50 latency
0.13ms
0.19ms
0.69ms
Memory idle RSS
44.5 MB
56.1 MB*
121.8 MB
Binary size
10 MB
17 MB
~350 MB†
*Swift RSS varies; historical range 27–56 MB.
†Node.js binary size includes node_modules.
What I got wrong
Swift won’t be fastest by default. The actor model is genuinely good — the safety guarantees are worth having — but the LLM naturally reaches for the most correct-looking structure, not the most profiled one. Two actors sounds right. Two cooperative suspensions per request at 5–15μs each is 139 ops/s.
Node.js won’t be dramatically slower. Sequential write gap is Go at 4,370 vs Node.js at 2,975 — 1.5x, not an order of magnitude. Concurrent writes are worse (12,122 vs 2,479), but that’s a fundamental architectural constraint: better-sqlite3 is synchronous and serializes on the event loop thread. When Node.js can hand work to C++ it does it efficiently. OpenSSL through the native crypto module isn’t a slow JavaScript wrapper. V8 has had a lot of investment. The runtime isn’t what’s slow.
Bravo to Node.js for holding its own, despite being the icky slow JavaScript it’s said to run underneath.
Go wouldn’t just be a nice middle ground. It won across the board, often by a significant margin. The stdlib is extremely well optimized — SHA-256 uses BoringSSL, hex encoding is direct byte ops with no reflection, the HTTP server is Google’s own production-grade work. The LLM went with stdlib throughout and the choices held up. Go’s single-minded approach to simplicity and performance tuning does make you want to hold everything else to the same standard.
The actual takeaway
In every case, the initial code looked correct. The Swift actor chain passed strict concurrency checking. Web Crypto is the officially recommended modern API. String(format:) is in Apple’s own documentation examples. None of these were bugs.
LLMs optimize for code that looks right and follows documented patterns — which is most of what’s been written. They don’t profile. They don’t have a feel for what a given abstraction costs.
What ended up being useful wasn’t writing more code. It was asking “what is this actually doing at runtime?” when something already looked clean, and being willing to measure rather than assume. And then having your assumptions turn out to be wrong anyway.
The Node.js version got the most guidance, as it was the first implementation. The more autonomous Go and Swift implementations had more interesting structural problems — “less hand-holding” just meant the LLM made its own decisions, and some of those were questionable.
Augmenting the coding environment’s system prompt, using proper guardrails in agent config, or reaching for ecosystem-specific best-practice files would probably steer the LLM faster. But the experiment was to see what the defaults are. And many of those defaults are bottlenecked by the model’s knowledge cutoff — which is a different and increasingly depressing story.
These benchmarks are single-machine, in-process, no network latency. The LLMs used were a mix of locally-hosted Qwen 3.6 27B, OpenCode Go’s DeepSeek V4 Flash, and some Claude Code.
Came a bit late to the whole AI agents fun, so I decided to write my own harness thing in Golang. The idea of it running with scissors around my filesystem was pretty scary, so I limited its file write capabilities to the workspace directory.
Only a handful of shell commands are whitelisted. The harness attempts to limit command output to the workspace directory too, and, as a bonus, pipes commands to avoid cluttering up the context. Still need to encourage tail/head/grep use for text files to further optimize I/O and context use.
Additional shell commands can be enabled by creating a skill that has to be verified and approved by the user using slash commands. Still figuring out if and how those commands could be prompt-injected, so still lots to learn there as well.
But seeing the thing figure out commands by searching them through the Brave API, finding required parameters, and start performing background or scheduled tasks that consist of natural language commands is really cool. And all that using a self-hostedmodel.
Started getting the hype.
Also can see how agentic workflows like that quickly expose weaknesses of small, sub-10B models. Those get confused really fast, forget commands, tools, and skills, or ignore skill details, go for default parameters, and focus on the wrong stuff.
But on a sufficient model, it all just works, and the ability to tell my model-wrapper through WhatsApp to download a YT video for me, and check the news for a specific topic is pretty rewarding.
Need to make it figure out more about the world, tap into audio/video feeds, and can start preventing crimes too.
Noticed some forks popping up of my Valetudo Homebridge plugin, since it’s become pretty out of date due to REST API changes in Valetudo and lack of time on my part. I released a new beta yesterday that actually works now. Sorry and thanks for the nudge.
I finally got to implementing app state restoration in Headlines. Hoo boy, there’s so little comprehensive info on how to implement it when app’s whole UI structure is implemented in code, especially when it involves UISplitViewControllers. But in the end, it’s magical when it works!
I find it a little bit sad that people working their asses off to make an app sold for $3 feel the need to take part in the Black Friday sale. The prices especially on the iOS market are already heavily discounted.
Nice job, Apple and NVIDIA -- two of my favorite companies -- of making all of us lose, by being dicks to each other. But of them two it’s surely Apple that loses more by effectively limiting the eGPU hardware to one vendor.
Kind of hoping that it’s just NV forcing Apple’s hand for both to finally kiss and make up. Apple doesn’t even need to source NV GPUs for their computers, having been burned (haha) before — AMDs latest GPUs are completely fine. But having an option again to run CUDA on macOS would sure be nice.
I recently bought a Xiaomi Roborock S50 vacuum cleaner. On the surface, it sounds like a great product -- pretty affordable, makes for a good looking home appliance, and most importantly, good at taking over a mundane activity that should’ve been automated a long time ago.
On the software side, there is a pretty usable app that allows you to make the most of the device, like checking its current status, customizing some settings, such as cleaning speed, schedule, and several modes of cleanup - general one, spot cleaning, and with the use of the indoor navigation enabled by a laser sensor, zone cleanup, or setting up virtual barriers and no-go zones.
The app also enables you to control the vacuum when you’re away from your home Wi-Fi. It does that by taking advantage of the cloud, i.e. Xiaomi’s computers located in China.
That last thing creeped me out most about this product, and before making a purchase I made sure there’s a way to do something about that. Turns out, there is!
Rooting a vacuum cleaner is so 2019
The software is called Valetudo, and it is essentially a webserver that’s running on the vacuum locally, faking Xiaomi’s backend services. It is not the main piece of the puzzle, though, as putting that webserver on the device was enabled by the amazing work of a group of people behind Dustcloud, which brings a set of methods of opening up the device to hacking.
Installing Valetudo is a pretty simple procedure, and in the end, instead of a piece of software with an origin in a country of questionable respect for people’s privacy, you get a mobile-friendly web client served by that device as well. There is an option to run some of the stack on a home server, but that sounds like too much of a maintenance burden.
HomeKit it
As an Apple and home automation nerd, making all things HomeKit-enabled is important to me. The robot even with its original software is not compatible, but there are several plugins for Homebridge that connect both worlds. The thing is, those plugins don’t control the robot directly, but through the Xiaomi cloud. Once we freed the vacuum from it, we need to find another way. Valetudo with its locally-running web server is exposing a simple HTTP API, so there is a way to control it programmatically, but as niche Homebridge is, a rooted vacuum is surely an even narrower niche, although I can see an overlap in audience there.
There were some requests posted to the authors of the aforementioned Homebridge plugins to add compatibility with Valetudo, but rooting a vacuum seems to be too new of a thing, so in the end there were no plugins for Valetudo-enabled devices. Now that I’m recently also a Node.JS developer (huh?) making backends in Javascript (get off my lawn), I made one.
Make it
The plugin is called homebridge-valetudo-xiaomi-vacuum, it’s available through npm, and the basics are pretty solid already. It exposes a few cleaning modes as buttons, provides the battery status, and some other conveniences. And I had heck of a fun time making it.
Recently I have been asked a few times, mostly by disgruntled ex-iOS Android developers, whether Xcode does anything more with the source code than just color-highlight it or allow to jump around the sources by using Jump to definition.
One of the things people seemed to miss the most is the ability to find places which call the focused function, known as, among others, “Find calls” in other IDEs.
It’s true that Xcode has always felt more like a text editor with a compiler than an IDE that provides a rich user interface on top of the source code, like Eclipse or IntelliJ’s tools, for example.
Good news is, it does indeed have some cool code structure aware features hidden in the plain sight. This approach goes in line with Apple’s philosophy of a clean design that doesn’t overwhelm the user with available options. In case of a programming environment though, which is a specialized tool in hands of a perceptive and analytical user for several hours a day, such features could be perhaps a little more obviously visible.
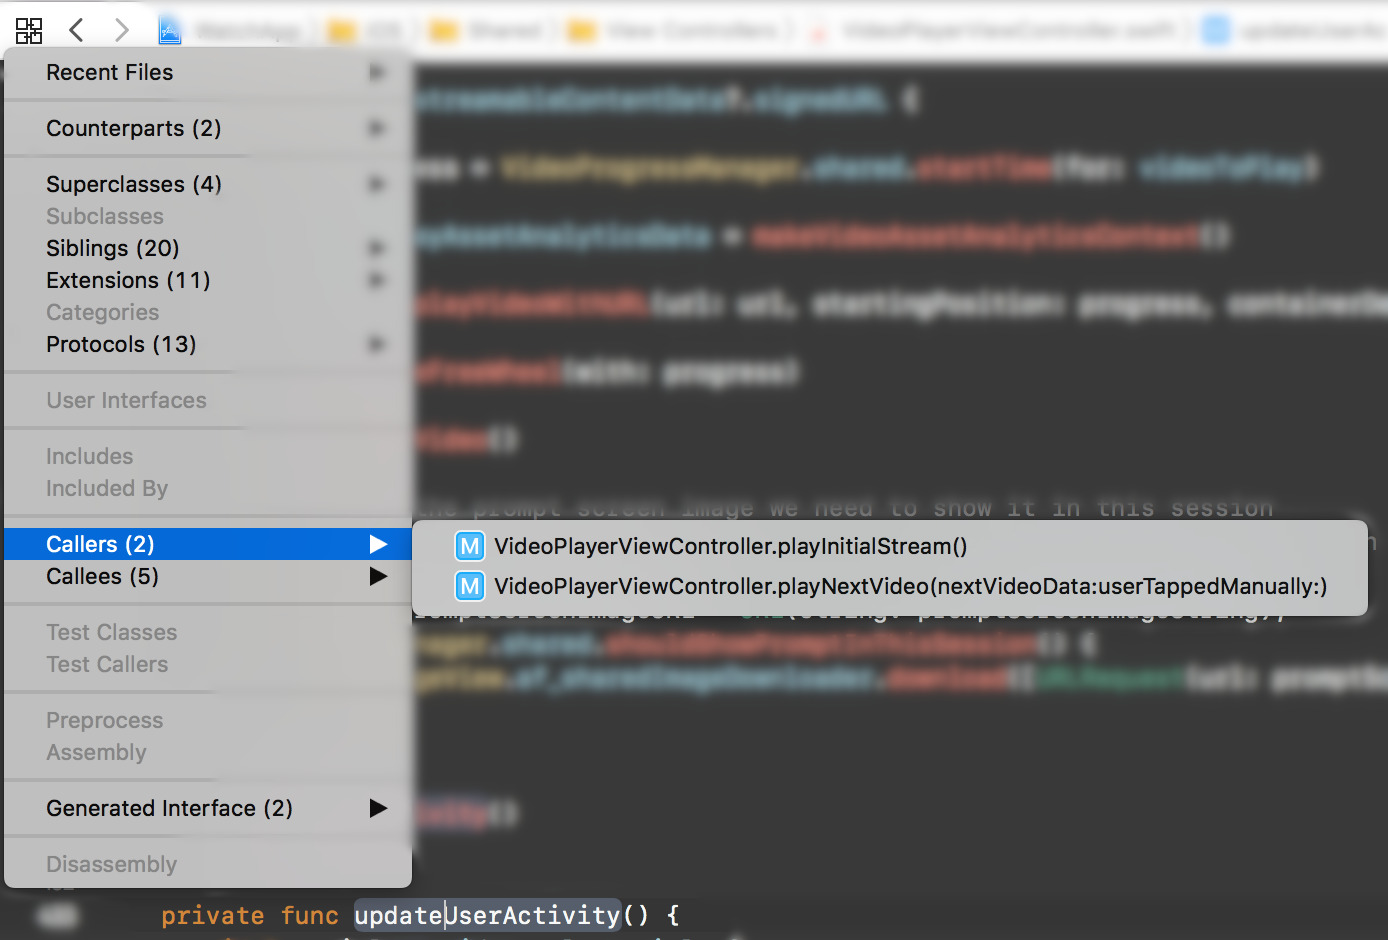
And so there is an extremely useful Related Items editor menu, by default available under a Ctrl-1 shortcut, that includes, among others, a Callers submenu. Yay!
Of course, its contents become available once Xcode manages to index and process app’s source.
The new 13-inch MacBook Pros are starting to look truly compelling. The keyboards seem to be fixed, all four Thunderbolt ports are full-speed, include crazy fast SSD. I’m ready to return my Escape 2016 as it’s broken by design. Thanks EU.
Sorry for the slight RSS feed screwup. I made a mistake of defining post and feed IDs as URLs containing blog site’s protocol. Had to rip that bandaid off.
If you happen to have issues resolving VPN-origin domains on a local network where your DNS server is a Tomato-powered router, make sure you have the “Prevent DNS-rebind attacks” option disabled.
Recommended post by Karl Seguin. I have come to the same realization pretty late in my development career, but at least early in the “tests are actually useful” phase. Before that I mostly relied on compiler’s work and somehow ignored the need to check the logic beyond syntactic correctness.
Loving the element that was missing in my blogging workflow — ability to post from my phone and have it published to the site automatically while keeping the static nature of content.
Thanks to Dropbox, DO Note and recently added features needed to blogger, which can now listen to post source directory changes, I finally connected the building blocks.
Recently the keychain on iOS has gained new capabilities in terms of security and privacy, especially around Touch ID. Let's explore some of those. Read more…
I'm happy to announce that after months of tweaks, real-world testing and foot-dragging, version 1.4 of Headlines is finally up on the App Store. Thanks to a coworker and a friend of mine that happens to be an awesome UX and UI designer as well, I'm extremely happy with app's updated look. Read more…
It’s great how Swift’s flexibility and lightness allowed me to return to heavily protocol-oriented programming. I dropped that idea a few years ago when doing Objective-C projects as it was too cumbersome there. Cocoa APIs still need some protocol-aware treatment though.
Have been digging into web development lately for a side project, and boy did things change since early jQuery days!
iOS 9 will default to a new connection security mechanism called App Transport Security that essentially forces apps to transfer data from their backend services using secure HTTP connection practices, like TLS 1.2 for instance. Read more…
As the setup of my blog requires creating a markdown file that follows a special template, I kept finding excuses to not write anything, because I had to perform a few awkward steps:
copy an existing post file,
change the date to near future,
fill it with new content and finally,
publish it.
It felt dirty and unelegant, so I implemented an option in blogger that prints out a specific template, be it a post or a snippet, which includes a header filled with time set to 15 minutes in the future, an example title and chosen author. My obsession for clean technical solutions to first-world problems is satisfied and blogging is fun again!
What if we kept one master password and let our device generate an account- or site-specific passwords needed on-demand? It's definitely not a new idea, though I'm not entirely sure why not a very popular one. Perhaps there's a gap between the notebook/post-it and password database approaches I'm not aware of? Read more…
Welcome to 2015! After Headlines 1.1, 1.2 happened in December. And now, 1.3 is waiting for review with some great improvements. More details coming in a few days.
And here it is! Headlines 1.1 should become available during the next 24 hours.
Wow, the Apple review process seems to have crazily slowed down due to massive upgrade rush to iOS 8 and the new phones. More than 10 days after submitting, 1.1 was still stuck in “Waiting for review” status. Luckily (!) I found a crashing bug in the app, so I requested an expedited review and just got an email that the request has been accepted.
Posts by Manton Reece and Noah Read, as well as a recent Core Intuition episode 155 inspired me, among other things, to add snippets on my blog. Though it's a lot easier to switch to a Twitter app and simply tap away, Twitter owns whatever you write to the level of controlling the way it's allowed to be shared outside of the ecosystem. I.e. it's a platform that's open to content being added to it. Read more…
As a tangent to Pragmatic episode 38, I wonder if and when Apple will move to USB Type-C in Macs. For sure for a lot of people it will be either too late, or too soon.
Facebook's timeline algorithm has received a lot of heat in the last few months after it was revealed that the timeline was essentially a part of an experiment and users following the default "Top stories" timeline were the test subjects. Read more…
I usually set up assertions in methods in order to guard correctness of incoming parameters, outgoing results and invariants, but this technique looks very interesting. Here the contract can be set up in one place and modified without changing the methods’ implementation.
So, you surely know about the whole shoemaker and his wife’s shoes thing. This has been a long time coming, but I finally got around to making a static site generator, like all the cool kids do these days.
I hope I will be able to find time and will to make good use of it.
func hello() -> String {
  return "Hello"
}
Hold on, that’s not Go. Looks like Apple cooked up something equally interesting. Good times!